It is the canvas of mathematics. From simple school graphs to complex computer graphics, everything starts with two intersecting lines.
The Definition
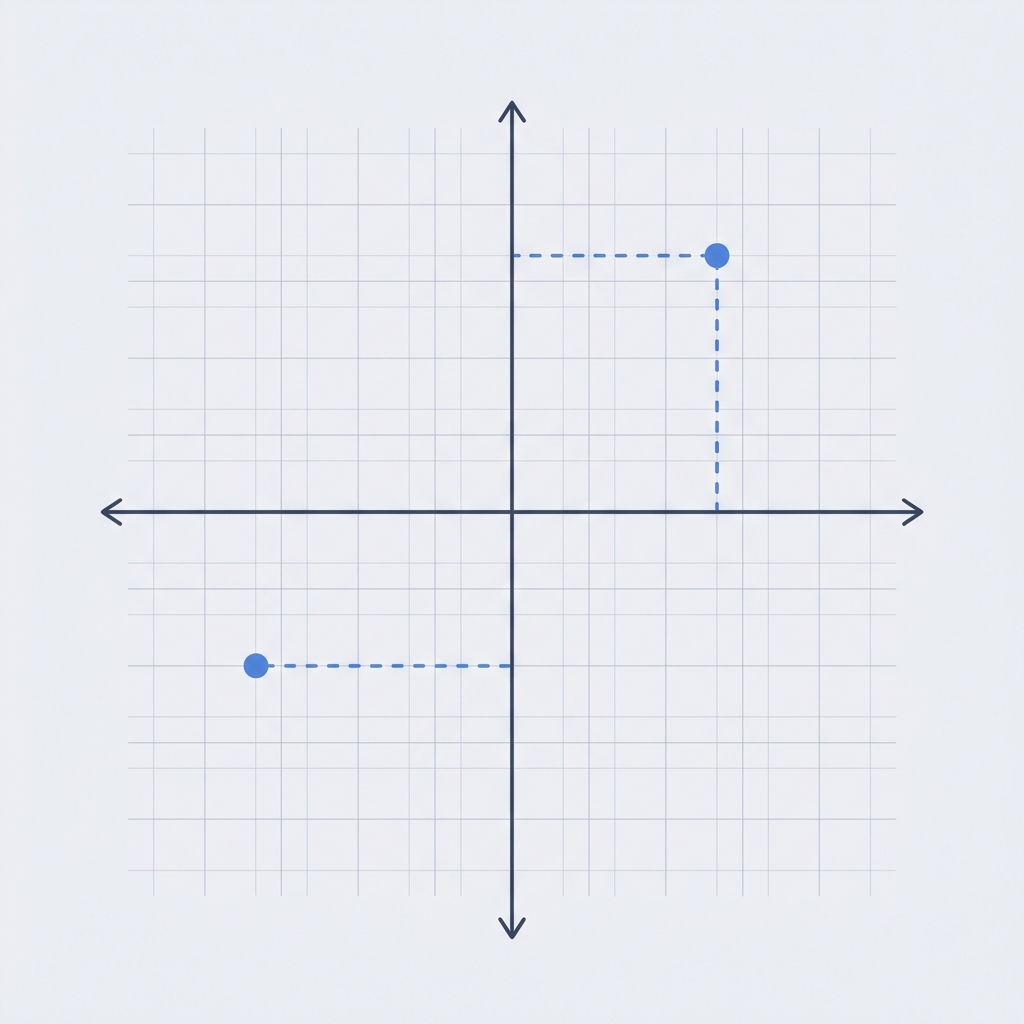
A Cartesian Plane (named after French mathematician René Descartes) is a two-dimensional surface formed by two number lines intersecting at a right angle.
Think of it as a grid that allows you to pinpoint any location continuously using two numbers: an x-coordinate and a y-coordinate.
Legend has it that René Descartes formulated this system while lying in bed, watching a fly crawl on his ceiling. He realized he could describe the fly’s exact position by measuring its distance from two adjacent walls.
The Key Components
- XThe X-AxisThe horizontal line. Moving right is positive (+), left is negative (−).
- YThe Y-AxisThe vertical line. Moving up is positive (+), down is negative (−).
- OThe OriginThe exact center point where the axes cross.
Interactive
Move your mouse over the grid to see how coordinates change.
The Four Quadrants
The crossing axes divide the plane into four distinct sections called Quadrants. We number them with Roman numerals (I, II, III, IV) starting from the top right and moving counter-clockwise.
A small detail that trips a lot of students up: a point sitting on an axis does not actually live in any quadrant. The point is on the y-axis, and is on the x-axis. The origin itself is the only point shared by both axes, and it belongs to neither side.
Once you internalise the sign pattern of each quadrant, you can usually tell where a point belongs without even drawing the grid. See a pair like ? Both negative, so it is bottom-left - Quadrant III. A pair like ? Positive x, negative y, so it drops into Quadrant IV.
How to Plot a Point Step-by-Step
Plotting becomes second nature with practice, but the steps are worth spelling out. Suppose you are given the coordinate and asked to mark it on the plane.
- Start at the origin. Put your pencil on the centre point where the two axes meet. This is your launching pad for every coordinate.
- Move along the x-axis first. The first number is the horizontal distance. Here it is , so move three units to the right. If the number were negative, you would move left instead.
- Then move along the y-axis. The second number is vertical. With , drop down two units. A positive y would have you moving up.
- Mark the spot. Wherever you finish is the location of the point. Draw a small filled dot and label it.
The order matters. X always comes before y in a coordinate pair, and the convention is alphabetical for a reason - it is easy to remember. Some teachers use the phrase "across the hall, then up the stairs", which captures the same idea visually.
Graphing a Linear Equation
One of the most powerful uses of the Cartesian plane is visualizing algebra. Let us take a simple linear equation:
To graph this, we plug in a few values for to find .
| If x is... | Then y is... (x + 2) | Coordinate |
|---|---|---|
| 0 | 2 | (0, 2) |
| 2 | 4 | (2, 4) |
| -2 | 0 | (−2, 0) |
The points form a straight line.
A Short History of the Idea
Before Descartes published his work in 1637, algebra and geometry were treated as two different worlds. Geometry was about shapes, lengths and angles. Algebra was about symbols and equations. Connecting the two seemed almost philosophical.
What changed everything was a small leap: the realisation that any equation in two variables can be drawn as a curve, and any curve can be described by an equation. That single bridge gave us analytic geometry, and it eventually made calculus possible. Newton and Leibniz were building on Descartes' coordinate system a few decades later, and we still use the same setup in classrooms and engineering software today.
Real-World Applications
You might ask, "When will I ever use this?" The answer is: every day. Here is how the Cartesian plane powers our modern world.
GPS & Navigation
Maps use a coordinate system (Latitude and Longitude) to pinpoint your location anywhere on Earth, acting just like a giant Cartesian plane wrapped around a sphere.
Digital Screens
Every pixel on your phone or laptop screen has an (x, y) coordinate. That is how the value of every specific color is assigned to the right spot to form images and videos.
Data Visualisation
Scatter plots, line charts and bar graphs all live on a Cartesian grid. Whether you are looking at stock prices or a science experiment, the underlying canvas is two perpendicular axes.
Game Design & Animation
Game engines track every character, projectile and camera using coordinate pairs. Move a sprite ten units right and five up, and you are doing pure Cartesian arithmetic.
Architecture & CAD
Architects and engineers draft on a coordinate grid. Walls, doors and fixtures are placed by typing exact (x, y) values, which keeps every measurement precise and reproducible.
Robotics
A robot arm on an assembly line moves to coordinates supplied by its controller. Each weld or pickup is just another point being plotted - only this time the pen is a tool head moving in physical space.
Common Student Mistakes
Almost everyone slips up the same way at first. If you can spot these early, you will save yourself a lot of red ink on homework.
Mixing up X and Y
Remember the golden rule: walk before you fly. Always move horizontally (x) first, then vertically (y).
Sign Errors
Watch out for negatives. In Quadrant III, for example, both coordinates must be negative.
Inconsistent Scale
If one square equals one unit on the x-axis, it should equal one unit on the y-axis too - unless you have a clear reason to stretch. A skewed scale makes lines look like the wrong slope.
Forgetting the Origin
Every measurement is taken from . If you start counting from the wrong corner of the page, every point on the graph will be shifted.
Frequently Asked Questions
Why is the origin (0, 0)?+
Can we have 3 coordinates?+
Who invented the Cartesian Plane?+
What is the difference between an axis and a quadrant?+
Does the order of x and y matter when writing coordinates?+
Is the Cartesian plane the same as a graph?+
Why do we use Roman numerals for the quadrants?+
Build your scatter plot in seconds - free, no signup.